One of the most fundamental values of shelter and the architects who create it is the ability to enhance the natural condition to improve human health and safety. Since the 1970 Clean Air Act, California has been at the forefront of air quality issues. The importance of air and environmental conditions to health, wellness, and satisfaction is both an accepted fact and a shared value in our community.
The science of healthy environments has been there for decades, but in practice architects, planners and designers have not had access to the data they need to understand conditions and trends for the actual sites they are designing and, more specifically, how these sites actually operate relative to their designs. The increased complexity of and rapid changes to user requirements and market conditions can stress the design resources available to provide healthy environments, relegating such decisions to the fringe.
With California’s mounting frequency of unhealthy air caused by the spread of wildfire plumes, the inability of our architecture to ensure healthy places in a COVID-19 world, and sick buildings still a recurring syndrome, deeper attention to the performance of the built environment relative to occupant health is increasingly important.
Emerging advances in sensors, communications, and data processing are giving rise to affordable technologies that can augment architectural intelligence, empowering architects to design differently when informed by hyperlocal predictive and operational data. Our community of California architects has the opportunity to continue our leadership on these issues. We can use these new tools and the data they provide to design and build truly healthy spaces.
The Power of Data – Identifying Microclimates and Intra-Building Variation
Conventional sources of weather and air quality data may rely on one or two measurement locations for a given area or city and update hourly. This level of granularity is insufficient to plan an outfit, let alone a building. What we see when we deploy hyper-localized sensors, indoors and out, is significant variation of air and environmental conditions within a single city, within a single floor of a building, or even at different planes of the same room.
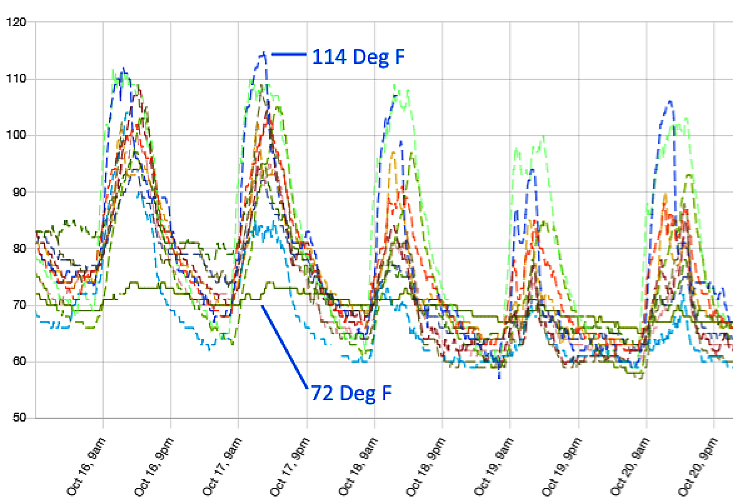 Outdoor temperature readings at 12 sites across SF Bay Area – Southern Marin through Central Peninsula, showing >40 degree Fahrenheit differences across the same metro area.
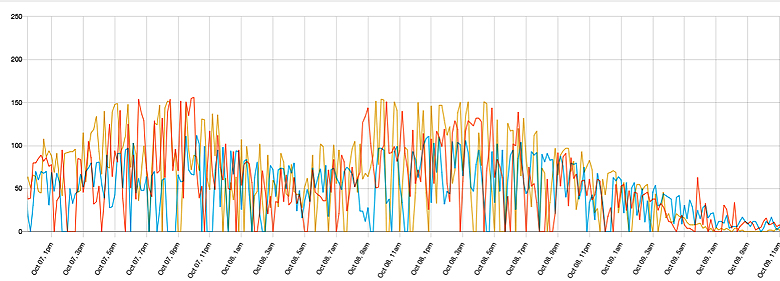 Air Quality Index (AQI) readings in different rooms within a single building, showing 90+ AQI point differences between rooms.
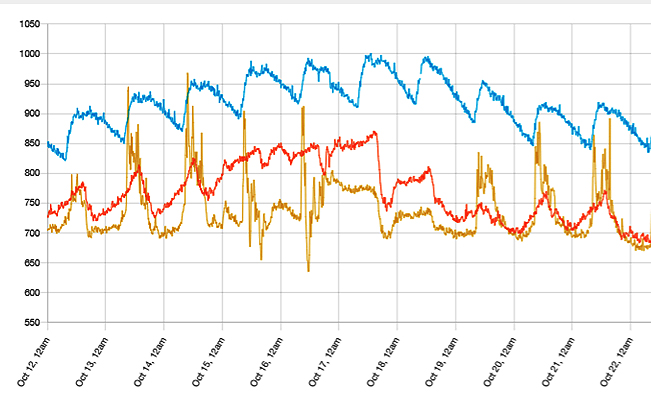 Total Volatile Organic Compounds (VOC) readings on a single floor in one building, showing 250+ PPM VOC variance between rooms on the same floor.
Every step in the design of a built space is a decision. The tools now available at an accessible price point allow us to map movement pathways, pollutant spread, and space use. We can now understand, model, and design for cross contamination, wellness, and desire lines. Once built, we can remain connected to our projects, watching, in real time, how the built environment performs at a human level.
Armed with these new avenues of understanding, California architecture can initiate a movement towards Health Centric Design. Just as Sustainable Design utilized data points such as Carbon Footprint to drive attention to the value and beauty of environmentally sound design, the healthy building movement can utilize these new data points to demonstrate the reasons for and benefits of Health Centric Design.
In practice, this data can be applied to recreate the way architects approach key design factors of the built environment:
- Dynamic, real time monitoring of both indoor and hyperlocal outdoor air quality can provide actionable insights, allowing architects to design and build elegant ventilation systems that maximize energy use and clean, fresh air.
- VOC monitoring can inform materials selection.
- Carbon dioxide measurement may lead us to rethink space occupancy and ventilation protocols, designing spaces for collaboration that maximize cognitive capacity and productivity of occupants.
- Healthcare designers can assess the likelihood of cross-contamination based on patient, staff, and physician user flows and contacts.
- Retail and food & beverage spaces can be designed to address observed friction points and the environmental, architectural, and behavioral conditions that cause them.
- Education facilities can be designed with a deep understanding of collaboration patterns, environmental impacts on testing, and student teacher interaction.
Many, if not all, of these factors already inform our designs, but what this data unlocks is increased granularity, quantitative assessments of confidence, and improved modeling. This is an opportunity to add a new set of tools to our design toolkit, allowing data to inform our designs.
Once our community chooses to further embrace these new data streams as inputs into design, we can design and build demonstrably healthy spaces and provide our clients with the built environments and ongoing data feeds they need to more effectively fulfill their commitments to the communities they serve.
Author Chris Anderson is CEO of RoundhouseOne, a spatial auditing and spatial intelligence consultancy based in San Francisco. RoundhouseOne is affiliated with MKThink, which is headed by Mark Miller, FAIA, a member of the arcCA DIGEST editorial board.
From arcCA DIGEST Season 07, “Concerning California.”